¶ Practical Recommendations
At the start of a project, generate a baseline so that actual progress to-date can also be compared to the original schedule.
- ProjectContexts allows the User to generate a (theoretically) unlimited number of baselines. We suggest generating a new baseline only after a major change, especially a change in project scope.
- ProjectContexts progress is directly linked to approved timesheets. We recommend that the schedule is updated with each timesheet cycle, e.g. weekly, etc.
¶ Auto Progress Reports
Timesheets are linked to tasks and systems. At the end of each timesheet cycle, the progress of the schedule elements (% completion) is updated automatically, all the way from the task % completion to the project % completion.
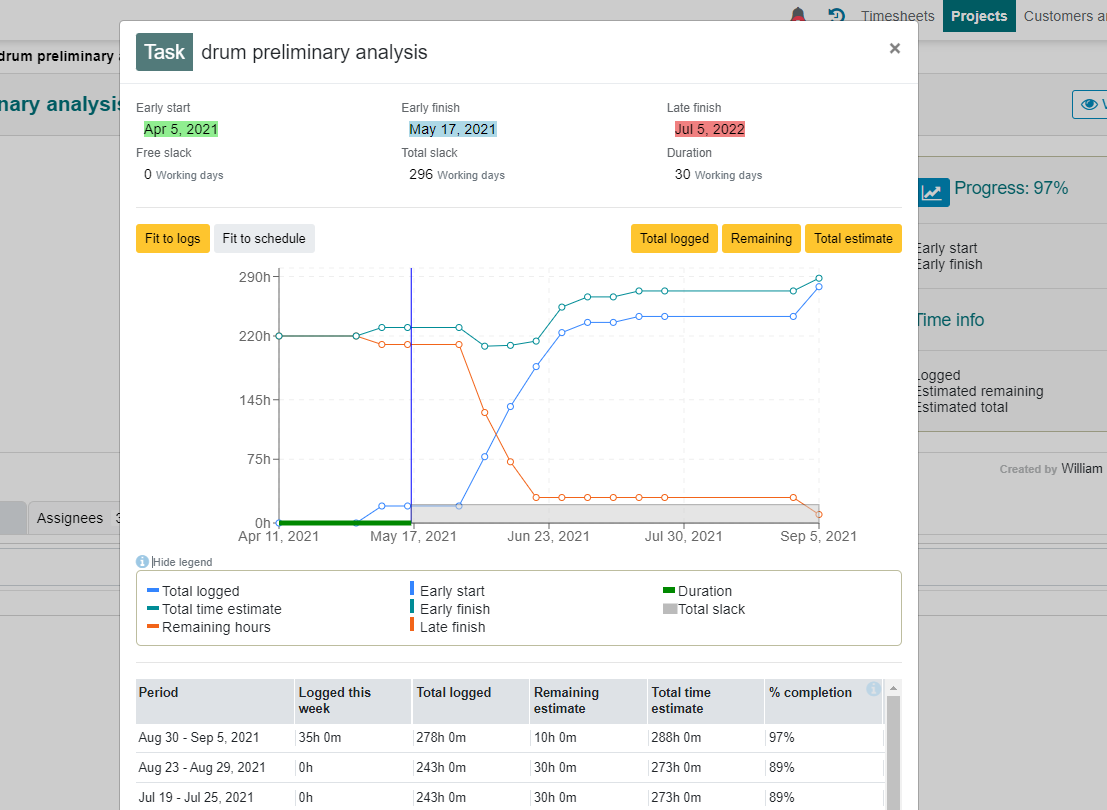
The example below shows a progress report for which the actual start and the duration had NOT been updated: the schedule (Gantt chart) is still recalculated as if start = April 5 and the finish =May17.
In this one snapshot, the most important evaluation information is provided. Earned Value (Release 2) can be gleaned already from this report. For example, we can see that the present estimate for hours at completion is 288 hours, whereas the initial estimate was 220 hours.
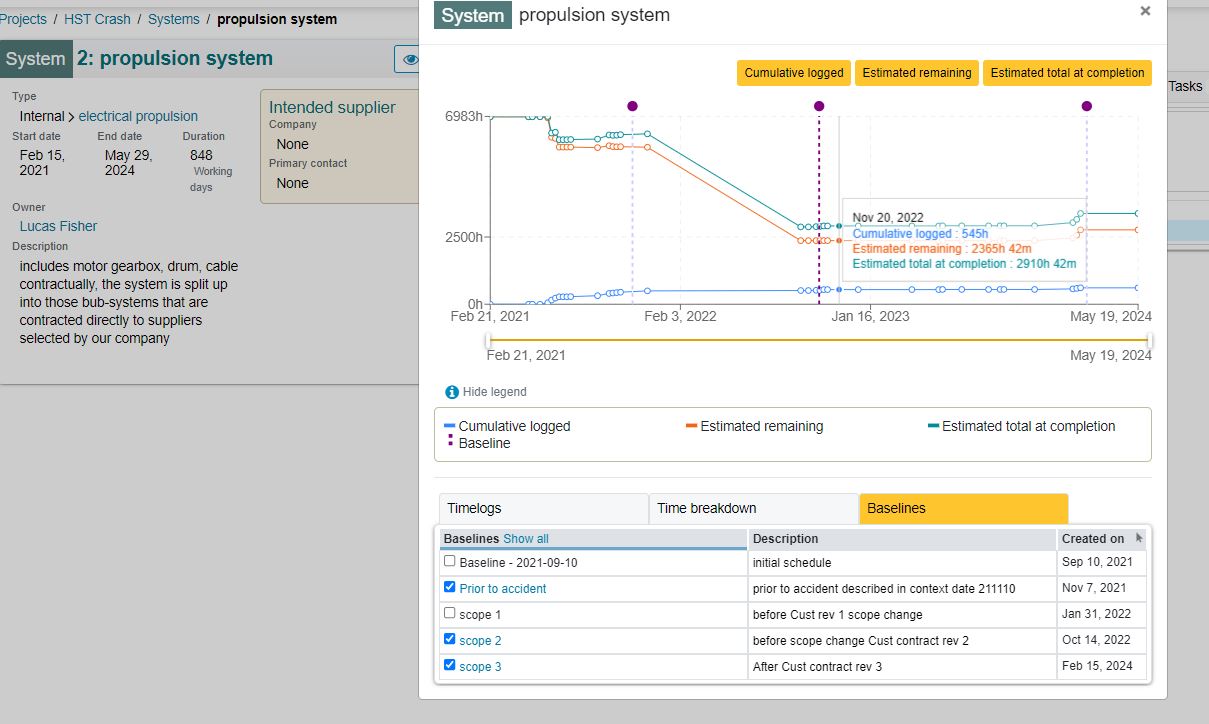
We can also superimpose baselines onto the progress graph: It allows better interpretation of what may have been the cause of an unexpected progress behaviour:
¶ Baselines - Schedule
Baselines can be added at any point in time and the number of baseline schedules is unlimited..
The selected baseline is then graphically interfaced with the current schedule. However, there is a limit to what can be displayed graphically.
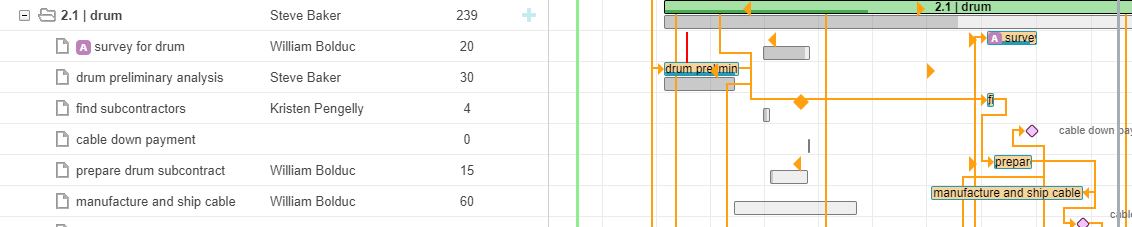
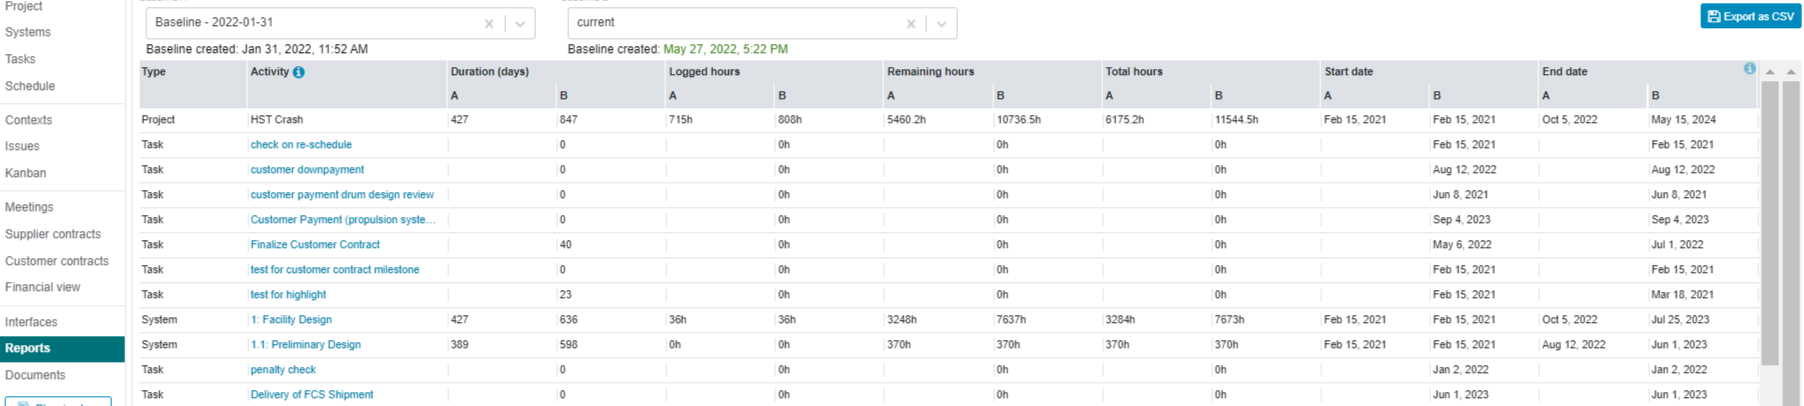
Therefore ProjectContexts also includes a reporting utility, to generate a comparison between current schedule and baseline schedule in table form, where the following will be compared:
- Actual hours
- Remaining hours
- Estimate for total hours at completion
- % completion
- Duration
In this report, baselines can be compared to the current schedule but to another baseline schedule as well. The list is exportable into a CSV format.
The baseline report includes a baseline name superimposed on the progress report
¶ Baselines - Costs
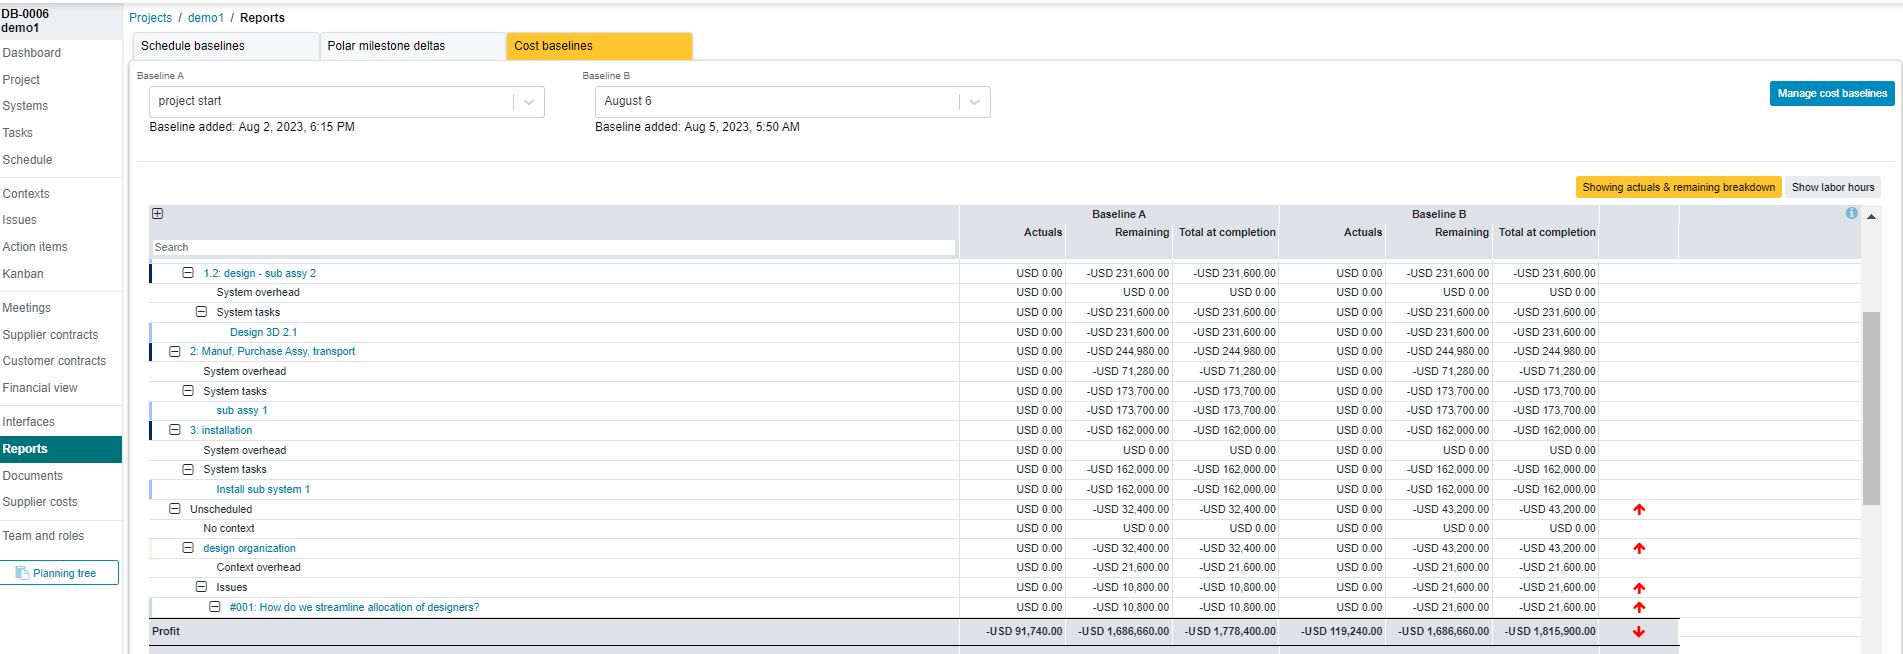
We can create baselines for costs as well, with a similar user interface for baseline generation and selection